The price of BTC has experienced peaks and valleys ever since the coin launched in 2009. Learn all about its ups and downs in this guide on Bitcoin’s price history.
Key Takeaways:
- Bitcoin launched in 2009 with a value of US$0. People largely mined for its tokens (BTC) on the Bitcoin network to obtain their share of the tokens.
- However, BTC would go on to hit the US$100 mark just four years later. In 2021, BTC hit an all-time high price of US$68,789.63.
- On the other hand, BTC has had its fair share of valleys throughout its history. At certain points in time — including 2018 and 2022 — it was trading at a discount of up to 50%.
- Nobody knows where BTC’s price is headed next, but steadfast enthusiasts who have held onto their tokens for several years have been handsomely rewarded.

The world’s first cryptocurrency, Bitcoin (BTC) was conceived in 2008 by a certain ‘Satoshi Nakamoto’ before launching in January 2009. Its release would pave the way for a deluge of blockchains and thousands of cryptocurrencies to enter the world. BTC’s price journey has been a highly eventful one from the start, undergoing its fair share of peaks and valleys.
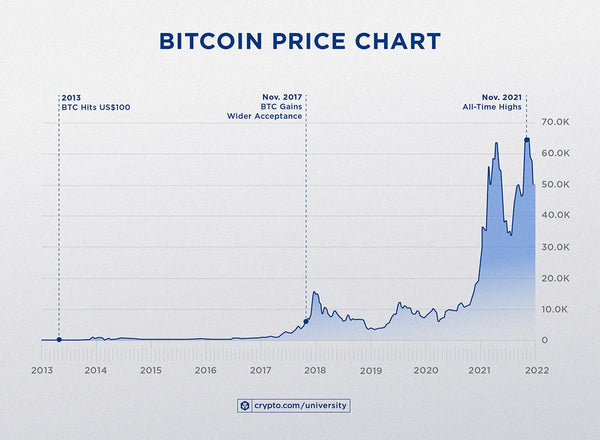
Across 2020 and 2021 alone, BTC’s price scaled new heights, breaking past the US$60,000 mark on two occasions to hit all-time highs. However, there were moments during this bull run when prices cratered, occasionally dropping by as much as 50%. With that, similar instances of high price volatility have been common throughout BTC’s history.
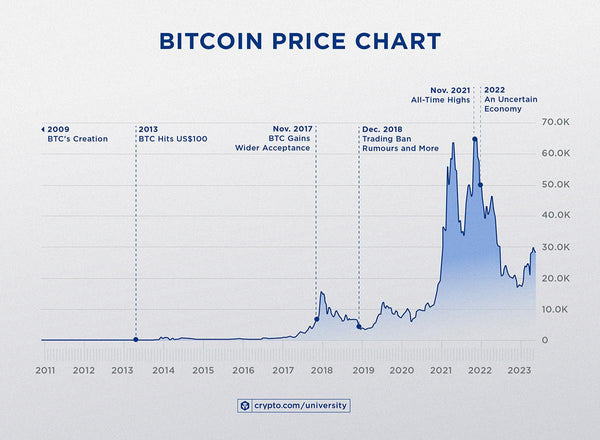
Upon first glance at BTC’s historical price chart above, it appears that prices swing wildly with no rhyme or reason. This couldn’t be further from the truth, especially as the cryptocurrency industry as a whole has continued to mature in recent years. Let’s take a closer look at BTC’s highest highs and lowest lows to understand what has driven these price movements.
Learn all about Bitcoin and how it works here.
Bitcoin’s Peaks and All-Time High
BTC has come a long way since it was first minted in 2009. During this initial stage, it did not have any value, and most people ‘mined’ on their computers to obtain their share of the cryptocurrency. Fortunately, this wouldn’t be the status quo for long. Check out three of BTC’s historical peaks below and discover what motivated these rallies:

Hitting US$100 (2013)
On 31 March 2013, BTC’s value hit US$100 for the first time after trading squarely at single- and double-digit values for the previous couple of years. At this point, there were several centralised exchanges (CEXs) on which people could trade BTC, in addition to the usual peer-to-peer (P2P) transfers. Many also pointed to the events in Cyprus at the time as a catalyst for this spike in BTC’s price.
The First US$10,000 (2017)
A similar scenario played out four years later, towards the end of 2017. As November came to a close, BTC hit US$10,000 after rallying steadily throughout the year. More merchants were accepting BTC as payment, and financial derivatives exchange operator CME Group announced a month earlier that it would launch a BTC futures marketplace.
Breaking US$60,000 (2021)
As the world continued to grapple with COVID-19 in 2021, BTC’s price broke the US$60,000 barrier on two occasions. At the time, analysts cited the US’s large stimulus package as a reason for this record-breaking move. Furthermore, BTC continued to gain acceptance from merchants around the world, including multinational companies like Microsoft and Starbucks.
Institutional investment in Bitcoin also significantly grew in 2021, with companies such as Tesla and MicroStrategy purchasing billions of dollars worth of BTC.
Bitcoin’s Lowest Lows
As with any other digital or traditional finance (TradFi) asset in the market, BTC’s price has hit a number of low points through the years. It’s common for prices to dip when more assets are sold than bought, but as mentioned above, there were times when BTC traded at a discount of up to 50%. Here are three of its lowest valleys and what might’ve caused them:

Starting at US$0 (2009)
No price charts are needed here for BTC’s humble beginnings. When the Bitcoin network was first launched in January 2009, and people mined for BTC, there was no value assigned to the cryptocurrency yet. Things would change in October of that year, however, when Finnish software developer Martti Malmi traded 5,050 BTC for US$5.02.
Freefalling Below US$10,000 (2018)
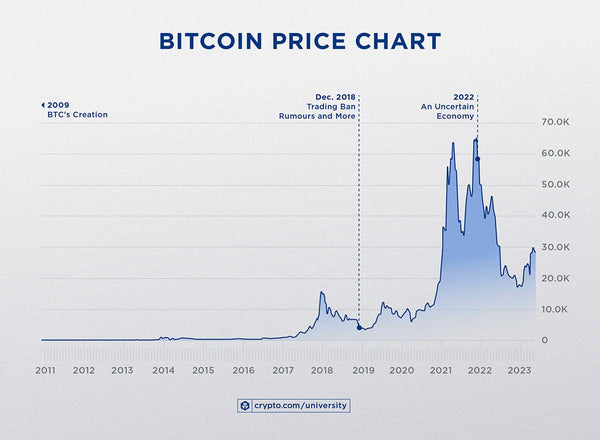
Although BTC’s price flew past US$10,000 in November 2017 to reach an all-time high of US$19,106 on 18 December, it trended downwards across 2018, even trading at US$3,421 in December of that year. Two events that contributed to BTC’s price collapse were rumours of a cryptocurrency trading ban in South Korea and Coincheck losing US$530 million in a hack.
Reaching US$20,000 in Crypto Winter (2022)
November 2021 was the last time BTC traded at US$60,000 and above…for now, at least. BTC’s price dropped throughout 2022, reaching a low of US$16,602 in November 2022. A number of events led to this ‘crypto winter’, including interest rate hikes from the US Federal Reserve, bad actors in the industry being exposed, and an uncertain global economic climate.
Final Words on Bitcoin’s Price History
Despite Bitcoin pioneering cryptocurrency — and 24/7 trading — while creating an entirely new industry, it is still considered a very young asset. Bitcoin’s large price swings through the years were par for the course, and events impacting the world’s economy, along with industry-specific happenings, do noticeably affect BTC’s price.
No one knows how BTC’s price journey will go, but enthusiasts who have kept their tokens while weathering the COVID-19 and global economic storms have been rewarded. To be exact, BTC’s price grew by approximately 341% from January 2020 to April 2023. Even those who regularly DCA-ed into BTC at its all-time high price would be happy campers now.
There will be many more changes to BTC’s price as the cryptocurrency industry grows and continues gaining wider acceptance from nations, corporations, and individuals. Where BTC’s price is headed, only time will tell.
Source: Crypto.com
